You’ve probably heard the old proverb, “the proof is in the pudding.” Most people, however, don’t know that this is a shortened simplification of the original expression: the proof of the pudding is in the eating.
You may get regular Amazon business reports directly (or from one of your marketing managers who is summarizing reports from Amazon for you), but are you using them effectively?
Just having access to data is not enough to make a difference to your bottom line. What matters is what you do with it.
This blog is an overview of several reports you can leverage right now to gain important insights into your Amazon sales performance. 
Sales Snapshot Summary
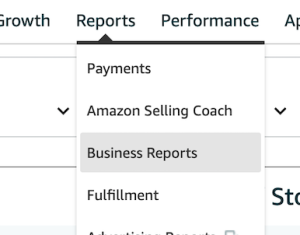
The sales snapshot summary helps to compare your overall sales within a specific window. As a snapshot, it is the quickest way to assess historic data year over year in overall sales, units sold, average units per order, and average order value. It’s default YoY comparison is a simple way to see how you are doing compared to last year at a quick glance, and is the default report pulled when you enter Amazon’s Business Reports.

How Is It Helpful?
If your sales are going up but your average order value is going down, it means you’re needing more transactions to meet the same sales revenue. More transactions may correlate to higher fulfillment fees for the same sales revenue. And if everything else is equal (cost of goods, ad spend, products sold), it hurts your profit.
Trendlines
Amazon allows you to view trendlines for any date range for the last two years. To flatten out the data you can also view by week or month as your data points. These trendlines can allow you to look at patterns in the overall direction of your sales as you plan for the future.
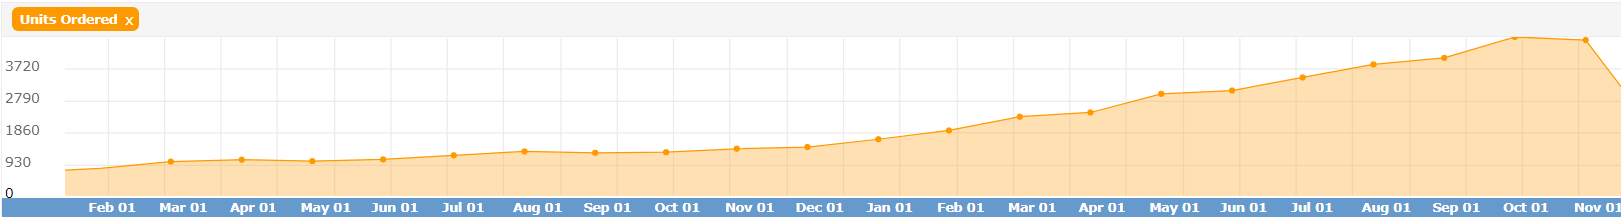
Units Ordered
See how you’re trending for actual units that you’re selling. A growing business is likely selling more units over time. If your products are seasonal, having 2 years of trendline shows you exactly when your products start to ramp and start to fall off.
How Is It Helpful?
Seasonal patterns shown in units sold trendlines can help you time when to order product for an anticipated uptick, when to invest more in advertising, and when to scale back on both. Also, if your revenue feels flat, but units sold is not flat, it can point to less profit (if more units sell for same revenue) or more profit (if less units sell for same revenue).Consider this: if you’re in growth mode, how do you know how to forecast inventory production for 3 months out? As shown in the illustration above, there is a pretty steady slope in recent months. Just carry that slope into the future as a well-guided estimate for 3 months from now.
Refund rates
Refund rates, on a healthy account, should trend flat or downward overall. Because refunds happen at a small percent, the trendline may look a little choppy, but an overall line can be estimated over time.

How Is It Helpful?
The on-going goal on returns is to reduce the refund rate. This is accomplished by clarifying content or images on Amazon product pages (to avoid confusion that you may discover from the reasons that customers give for return), reducing pricing (e.g., if customers return and complain that the product isn’t worth the price), or eliminating the item from your catalog. Over time, these tactics should help return rates decrease and level out. A high return rate or increasing return rate are calls to action.
Gross Sales Revenue
Different from units ordered, the ordered product sales shows your revenue as a seller on Amazon.
Steady growth on a non-seasonal product catalog:

Cyclical patterns on a seasonal (summer) product catalog:

How Is It Helpful?
For sellers of both seasonal products and consistent selling products, having an idea of overall revenue can help with cash flow planning on future investment of advertising, marketing, or product expansion. Can tomorrow’s anticipated higher revenue help finance a new product’s launch? Seeing tomorrow’s estimated sales is an additional data point for decisions made today about future impact on cash commitments.
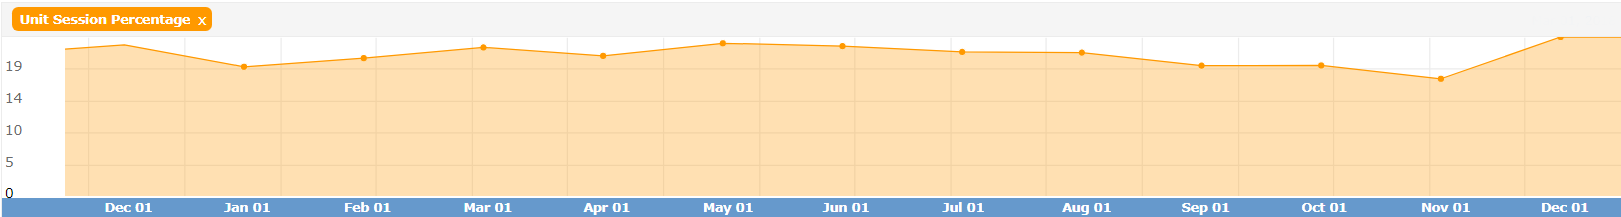
Unit Session Percentage
The closest thing Amazon has to “conversion rate”, the Unit Session Percentage is the number of units sold divided by total sessions to your product pages. If you sell 30 units from 300 product page visitor sessions, your Unit Percentage Rate is 10%. There is no target rate that applies for all categories and product types. For some very competitive low-priced products (e.g., shampoo), 2% is an excellent rate, while other types of specialized products may be able to hit more than 50% (e.g., a replacement power cord that fits a specific laptop model). Toucan actually has one client with a unit session percentage above 100% meaning the average customer is buying more than one product.
How Is It Helpful?
When everything stays the same, so should Unit Session Percentage. When Unit Session Percentage shifts, it’s important to find the reasons why. If it goes up, it means more people who visit your product pages are purchasing. On the surface, this seems good — but what if the conversion rate is increasing because traffic is going down, except for your most loyal buyers? Unit Session Percentage is a barometer — when it changes, it’s time to explore and dive deeper. (Good) Product page optimization should help it go up, as does good Amazon advertising campaign optimization, as does higher Buy Box percent. New competitors, bad reviews, inconsistent stocking, and higher pricing can all cause lower Unit Session Percentage.
Page Views
How many Amazon customers aka “eyeballs” look at your product pages? If one of your company’s KPIs is brand awareness, this is a good measure. Page Views combines organic and paid (Amazon ads) traffic to your products. It does not include how often your products appears in searches — it only counts if an Amazon user looks at one of your product pages.
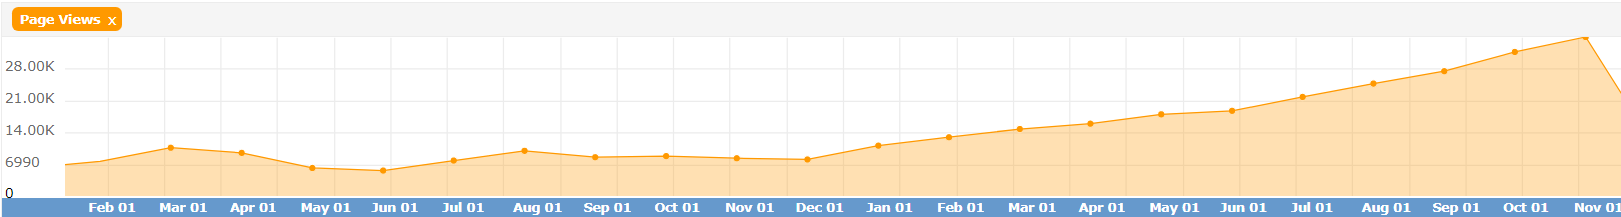
How Is It Helpful?
Increasing page views is a critical piece of long-term growth. Optimization for on-page conversion can only go so far. Throwing more eyes at your products is what leads to the long-term growth slope. Page View trending is a good litmus test to see if you’re heading in the right direction on your seller account. If Page Views is sloping down over time, alarm bells should be sounding.
Amazon Business Reports – Individual Products
If you have read our article on FBA inventory planning, this chart will look familiar to you. Child-reports allow you to export a CSV file for any date range within the past 2 years. If you generate one per calendar month, to compare data on specific SKUs. Each column tells you something specific and useful:

Term |
Meaning |
| Sessions | The number of unique visitors to your product page |
| Session Percentage | The percentage of your total unique visitors (across all your pages) for this specific product |
| Page Views | Total number of times the product page was looked at (this can include multiple/repeat visits from the same people) |
| Page Views Percentage | What percentage of all your page views were to this specific product |
| Buy Box Percentage | When a visitor landed on your product page, how often were you the featured seller in the buy box (ADD TO CART) |
| Units Ordered | Total number of units sold |
| Units Ordered – B2B | Total units sold specifically to business buyers |
| Unit Session Percentage | Ratio of units ordered to sessions (very similar to a conversion rate) |
| Ordered Product Sales | Revenue |
| Total Order Items | Your total orders that contained at least one of this SKU |
Making Sense of Your Amazon Business Reports
Lengthy articles and even books could be written on data analytics, best practices, and strategies to use these metrics effectively. This article was meant to provide a basic grounding in several Amazon business reports available to every seller and even some Amazon sales consultants, and what insight each report or metric can offer you. If you are having issues with the reports themselves, Amazon may be able to help.
Putting the bigger picture together can take time and years of expertise while deciphering for specific nuances or relationships among trends. Our Amazon experts are well-versed in Amazon business reporting and on standby to assist you with any questions you need to be answered to move forward. We’d be happy to have a conversation at any time so as you can become a more informed Amazon seller and ultimately increase your profitability from Amazon.